Despite the challenges of the Covid pandemic, it seems that house prices and the cost of living have risen, as has the ASX All Ordinaries and super fund returns. The only thing not going up right now would seem to be interest rates.
Here are some key indicators for you to help you ascertain the relative growth in your own property or share prices, as well as your super fund’s performance – and changes in household expenditure. Every household is different, of course, so it’s unlikely that yours will ever completely reflect these movements. Rather, they are provided as a handy benchmark for you to consider when assessing your end of year personal financial performance.
House prices
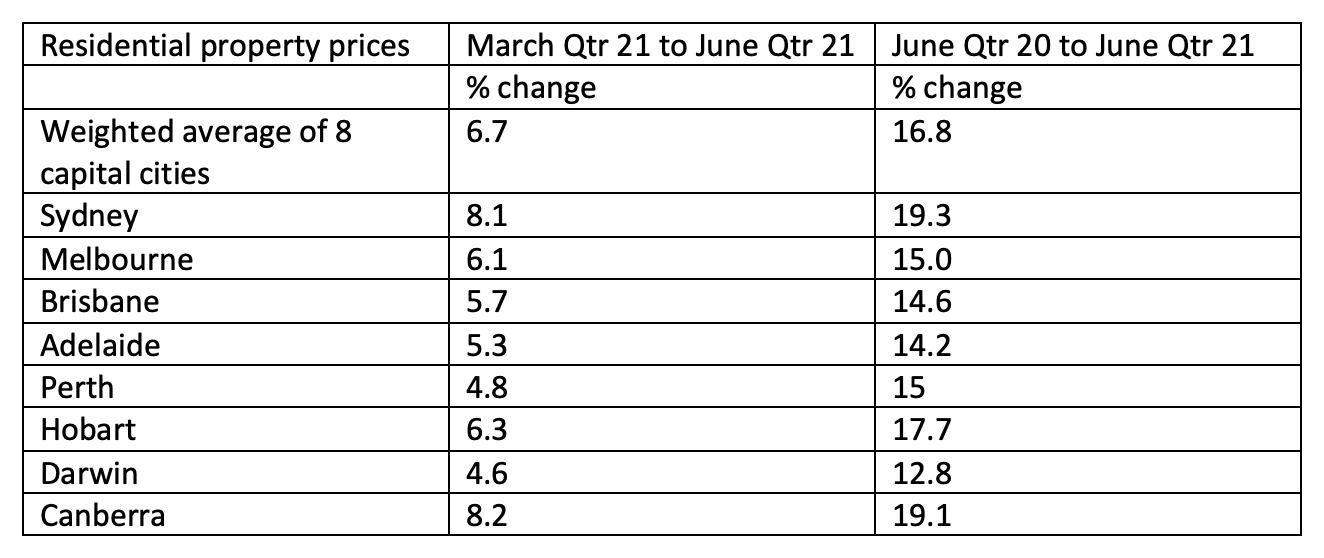
Measured by the Australian Bureau of Statistics (ABS), in the year to September 30, prices across the nation’s capital cities rose nearly 17%. The Residential Property Price Index (which follows home prices including apartments, units and townhouses, whether sold or not) rose 6.7% in the June 2021 quarter, the highest 3-month increase since December 2009. Capital city prices rose 16.8% for the year.
Capital city prices and increases are as follows:

Cost of Living
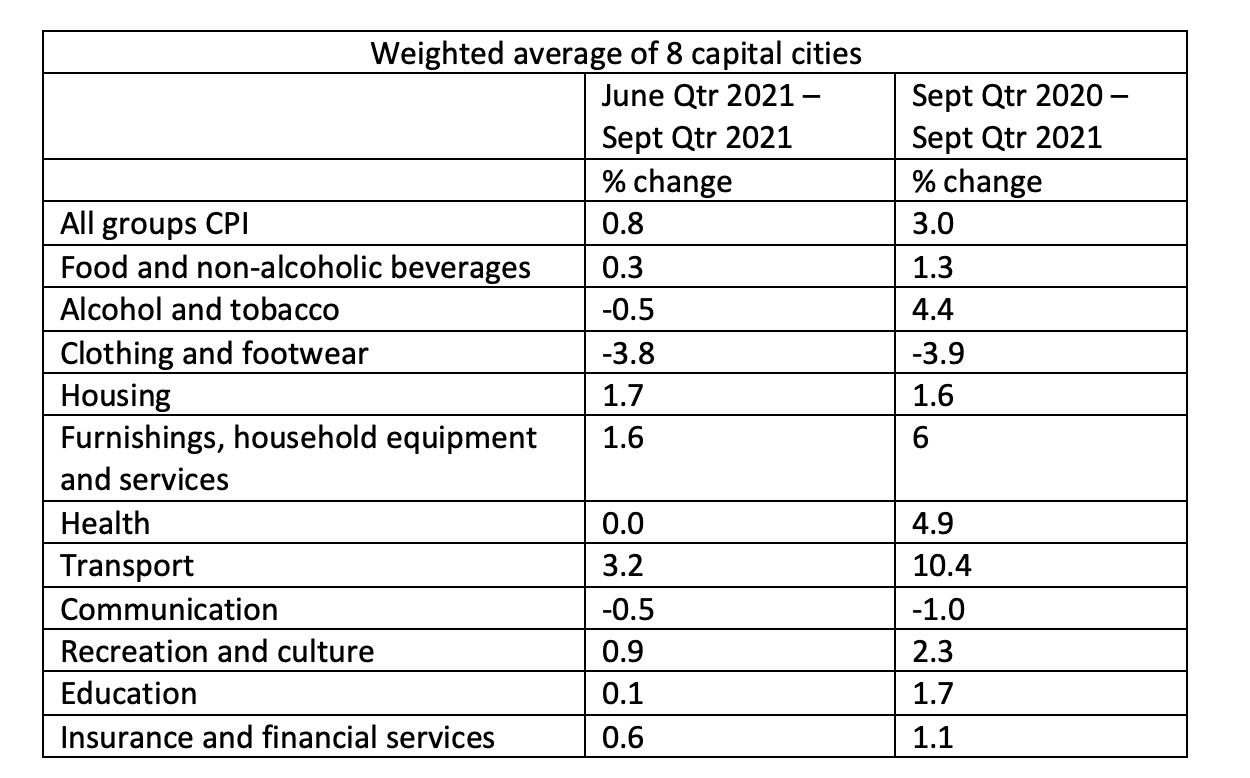
The ABS is also responsible for tracking quarterly cost of living changes. The most recent Consumer Price Index (CPI) was released at the end of September and covered the quarter ending on June 30, 2021.
- The Consumer Price Index (CPI) rose 0.8% this quarter.
- Over the twelve months to the September 2021 quarter, the CPI rose 3.0%.
- The most significant price rises were for new dwelling purchases by owner-occupiers (+3.3%) and automotive fuel (+7.1%).
The following tables shows changes to specific goods and services:

Source: Australian Bureau of Statistics
Share market returns
The Australian Stock Exchange (ASX) All Ordinaries Index is often quoted in terms of daily returns, which can lead to a rather volatile view of investment success. Longer term trends are usually more instructive. According to the Standard & Poors Global Index for the All Ordinaries (500 largest companies), the ASX All Ords rose 11.78% in the year-on-year trade from mid-December 2020 to mid Dec 2021. Check the index yourself, using this link, to see ongoing 12-month performance from any date you choose.
Source: Standard & Poors https://www.spglobal.com/spdji/en/indices/equity/all-ordinaries/#overview
Super fund returns
According to the Association of Superannuation Funds of Australia (ASFA), average balanced super funds have delivered around 9% per year for the five year returns and around 8.5% for the ten year average return.
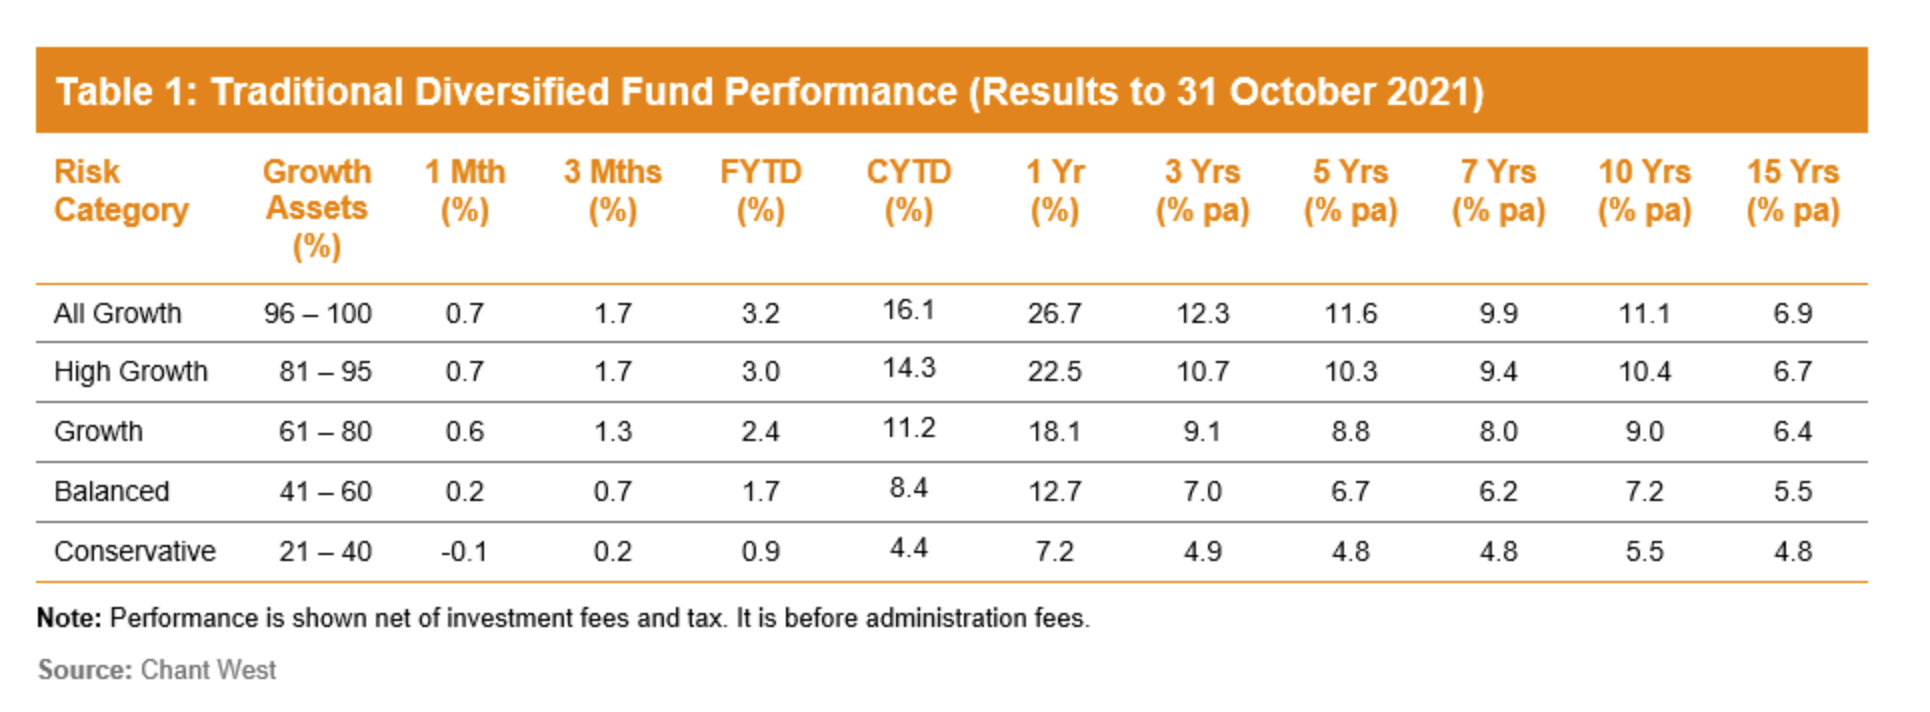
For the calendar year performance, we consulted ratings agency Chant West. It reported in mid-November that super funds were back in positive territory in October with the median growth fund (61 to 80% in growth assets) up 0.6% for the month. With nine positive monthly returns out of 10 to end October, growth funds were up 11.2% for the year to date. With share markets up in November, Chant West predicted that the median growth funds had a good chance of finishing 2021 in double digit territory.
The following table shows conservative funds with a 12-month growth rate of 7.2%, balanced funds at 12.7% and growth at 18.1%, as at the end of October 2021.

As mentioned, the above ratings are indicative only. The full calendar year information will be available around February. But we hope this information proves useful in assessing your own investments and outgoings. And if a short, specific financial advice consultation will help you better understand your income, investments and/or obligations, please schedule a time for an adviser consultation.
Property, investments and super are all important but so too is getting the Age Pension or Commonwealth Seniors Health Card. You can check your entitlements on our free eligibility calculator


Should I sell an investment house in Western Sydney?
Where would I invest these funds for a better return?
I am over 75 and not allowed to invest more funds into Super!
Should I invest in ASX?
Sorry so many ?
Cheers Mike